Win by the rolling dice
Need to make a perfect goal for win by rolling dice: How may I to solve Rolling a Pair of Dice ti express as my talent?
Name: Sumaya Liana
October 9. 2024
Abstract
Rolling dice like a tassing coin, which may be used to teach probability even if students know (or think they know) exactly what happens during these activities. This lab report discusses several simple probability/variations of these experiments that are interesting, possibly enjoyable, and interesting. Utilizing such variations can prompt students (and instructors) to look at the mathematical challenges together, allowing them to gain knowledge in their entirety. As an example of these experiments, most of the students pick points between 2-12.
Figure 1 -Materials
Introduction
Rolling dice feels like flipping coins as the sum of numbers, which explains how to solve mathematical and probabilistic lessons and provides valuable mathematical concepts in any mathematics class. Many people have different thoughts—for example, students under nine-ten who must understand probability concepts involving dice and coins may struggle with providing equal probabilities, like, What is the method? or feel hesitant to do so, especially with inferior reasoning abilities. Those facts can lead to students trying to learn how to find the outcomes of rolling a die or quickly tossing a coin. However, they may have to practice some experiments often, trying to understand some method of determining the meaning of/how to solve probabilities about rolling dice. If students keep practicing using their brains, they may understand how to do a rolling dice experiment and find the outcome, quick data collection, and easy analysis. For example In this experiment, we usually take two to twelve numbers because, by using those numbers, most of the time we get the highest outcome by coincidence, which is very fascinating.
Hypothesis: If the probability of every number showing then the number will change across a single dice or two dice trials (different numbers)
Figure 1 -Materials
- A pair of six sided dice
- A data-sheet for record number
- A calculator (just in case if i need to calculate or count)
- A pencil
Procedure/method
For this experiment, you first need a pair of comparable dice to compute the probability result. Dice roll probability. A pencil and a data sheet are essential for recording the different results. Following every roll, the total of both dice is calculated and written on the datasheet. Following every roll, the total of both dice is calculated and must be mentioned on the datasheet, like the results you got. You are required to do it 100 times.
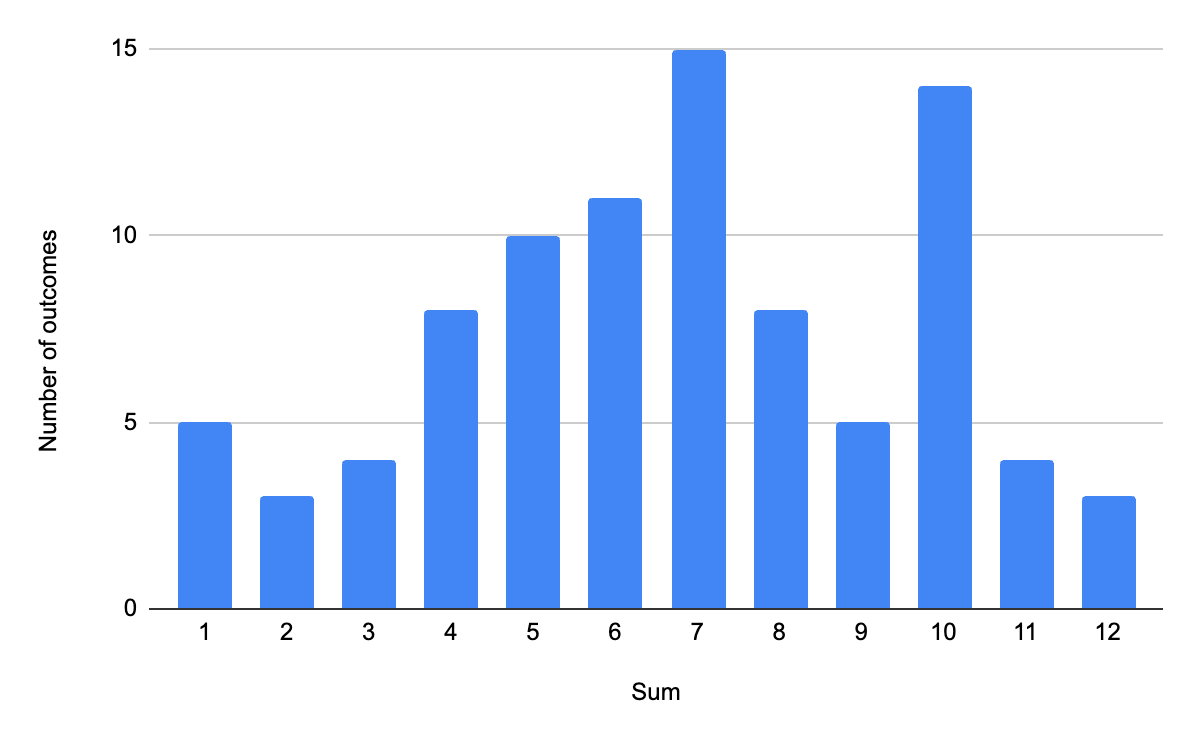
Figure 2-number of the results
| Sum of the rolling dice | Number of outcomes |
| 1 | 5 |
| 2 | 3 |
| 3 | 4 |
| 4 | 8 |
| 5 | 10 |
| 6 | 11 |
| 7 | 15 |
| 8 | 8 |
| 9 | 6 |
| 10 | 14 |
| 11 | 4 |
| 12 | 3 |
Figure 3-Number of results bar graph
Results
As a result, after recording the data for 100 rolls that I did, the outcomes are given in both Figures 2 and 3. As it was in the range of 6-8 as compared as before results, the highest number I got was 15 by the sum of seven, and the lowest one was 3, which is by the sum of 12. So the highest number from 6-8 is 15 in the number of 7; 2 and 12 both have the lowest number, which is 3.
Figure 4
Figure 4 Analysis/ compare
I took a pair of dice for this lab and rolled them to get my sum result. Related to hypothesis: If the probability of every number is shown, then the number will change across a single or two dice trials (different numbers). This means The probability of every number appearing changes across a single or two dice trials, as observations result in various numbers. I have stated that the outcomes of the heads of the sum of seven can be the highest result in coincidence. One difference is they found the outcome by using a method that is on the face (sum), finding frequency and proportion. (More advanced way). But I rolled the dice and then calculated all the numbers that showed how much I got so far, which means a simple way. One similarity is that first they found outcomes and then made a bar graph. I did the same way of finding the outcome of the sums as rolling the dice and calculated what I got, then created my own bar graph. (Attachment included below).

Figure 5
Conclusion
In conclusion, the roll of a pair of dice is demonstrated to give the most likely outcome of the highest number, but after 100 tries,using number 1-12, the correct result was between 6-8, which had a higher probability than other numbers. It suggests that possibilities six, seven, and eight are more likely to happen than others.completely works like magic.
References
- Dunn, P.K. (2003). What happens when a 1 ×1 × r die is rolled? The American Statistician,57, 258–264.Gelman, A. and Nolan, D. (2002). You can load a die, but you can’t bias a coin.
- TheAmerican Statistician, 56, 308–11.Green, D.R. (1983). Shaking a six. Mathematics In School, 12, 29–32.Hand, D.J., Daly, F., Lunn A.D., McConway,K.J. and Ostrowski, E. (1994). A
- Handbook Of Small Data Sets. London: Chapman andHall.Hawkins, A.S. and Kapadia, R. (1984).Children’s conceptions of probability: psychological and pedagogical review. Edu-cation Studies in Mathematics, 15, 349–77.Humble, S. (2001).
- Rolling and spinning coin: a level gyroscopic processional motion.Teaching Mathematics and its Applications,20, 18–24.Kerslake, D. (1974). Some children’s views onprobability. Mathematics in School, 5, 22.Moore, D.S. (2003).
- The Basic Practice ofStatistics (3rd edn). New York: WHFreeman.Rouncefield, M. and Green, D. (1989). Con-dorcet’s Paradox. Teaching Statistics, 11,46–9.Truran, J. (1984). Children’s understanding of symmetry. Teaching Statistics, 7, 69–74.
Work cited
Dunn, P. K. (2005). We Can Still Learn About Probability by Rolling Dice and Tossing Coins. Teaching Statistics, 27(2), 37–41. (Teaching statistics, 2005-04, Vol.27 (2), p.37-41, Article 37)
Appendix
Table of 100 Rolls showing Amount of Results so far
| Sum (roll of the dice) | Outcome of the Roll |
| 1 | 6 |
| 2 | 5 |
| 3 | 7 |
| 4 | 9 |
| 5 | 10 |
| 6 | 6 |
| 7 | 7 |
| 8 | 5 |
| 9 | 8 |
| 10 | 6 |
| 11 | 2 |
| 12 | 4 |
| 13 | 12 |
| 14 | 10 |
| 15 | 9 |
| 16 | 7 |
| 17 | 8 |
| 18 | 5 |
| 19 | 7 |
| 20 | 3 |
| 21 | 7 |
| 22 | 6 |
| 23 | 11 |
| 24 | 10 |
| 25 | 7 |
| 26 | 6 |
| 27 | 8 |
| 28 | 5 |
| 29 | 6 |
| 30 | 7 |
| 31 | 9 |
| 32 | 2 |
| 33 | 6 |
| 34 | 5 |
| 35 | 3 |
| 36 | 2 |
| 37 | 4 |
| 38 | 4 |
| 39 | 5 |
| 40 | 5 |
| 41 | 7 |
| 42 | 6 |
| 43 | 2 |
| 44 | 12 |
| 45 | 11 |
| 46 | 10 |
| 47 | 7 |
| 48 | 5 |
| 49 | 3 |
| 50 | 2 |
| 51 | 5 |
| 52 | 4 |
| 53 | 3 |
| 54 | 2 |
| 55 | 2 |
| 56 | 4 |
| 57 | 5 |
| 58 | 6 |
| 59 | 8 |
| 60 | 6 |
| 61 | 5 |
| 62 | 4 |
| 63 | 5 |
| 64 | 4 |
| 65 | 7 |
| 66 | 9 |
| 67 | 8 |
| 68 | 7 |
| 69 | 6 |
| 70 | 7 |
| 71 | 6 |
| 72 | 2 |
| 73 | 5 |
| 74 | 3 |
| 75 | 4 |
| 76 | 7 |
| 77 | 6 |
| 78 | 5 |
| 79 | 6 |
| 80 | 4 |
| 81 | 5 |
| 82 | 6 |
| 83 | 5 |
| 84 | 3 |
| 85 | 8 |
| 86 | 3 |
| 87 | 9 |
| 88 | 8 |
| 89 | 2 |
| 90 | 5 |
| 91 | 6 |
| 92 | 7 |
| 93 | 8 |
| 94 | 8 |
| 95 | 7 |
| 96 | 4 |
| 97 | 8 |
| 98 | 7 |
| 99 | 4 |
| 100 | 3 |

This entry is licensed under a Creative Commons Attribution-NonCommercial-ShareAlike 4.0 International license.